
The world of research is constantly evolving, and the topics that are considered “hot” today may not be the same ones that are popular tomorrow. With the ever-changing landscape of

How to do Simple Linear Regression in SPSSHow to do Simple Linear Regression in SPSS
Linear regression is a powerful statistical technique used to predict the value of a dependent variable based on the value of one or more independent variables. It is one of
Independent Samples t-tests in SPSSIndependent Samples t-tests in SPSS
The Independent Samples t-Test in SPSS is a statistical test used to compare the means of two independent groups. It is used to determine whether there is a statistically significant
One-Sample t-tests in SPSSOne-Sample t-tests in SPSS
One-sample t-tests in SPSS are a type of statistical test used to compare a sample mean to a known population mean. This test is used to determine if the sample
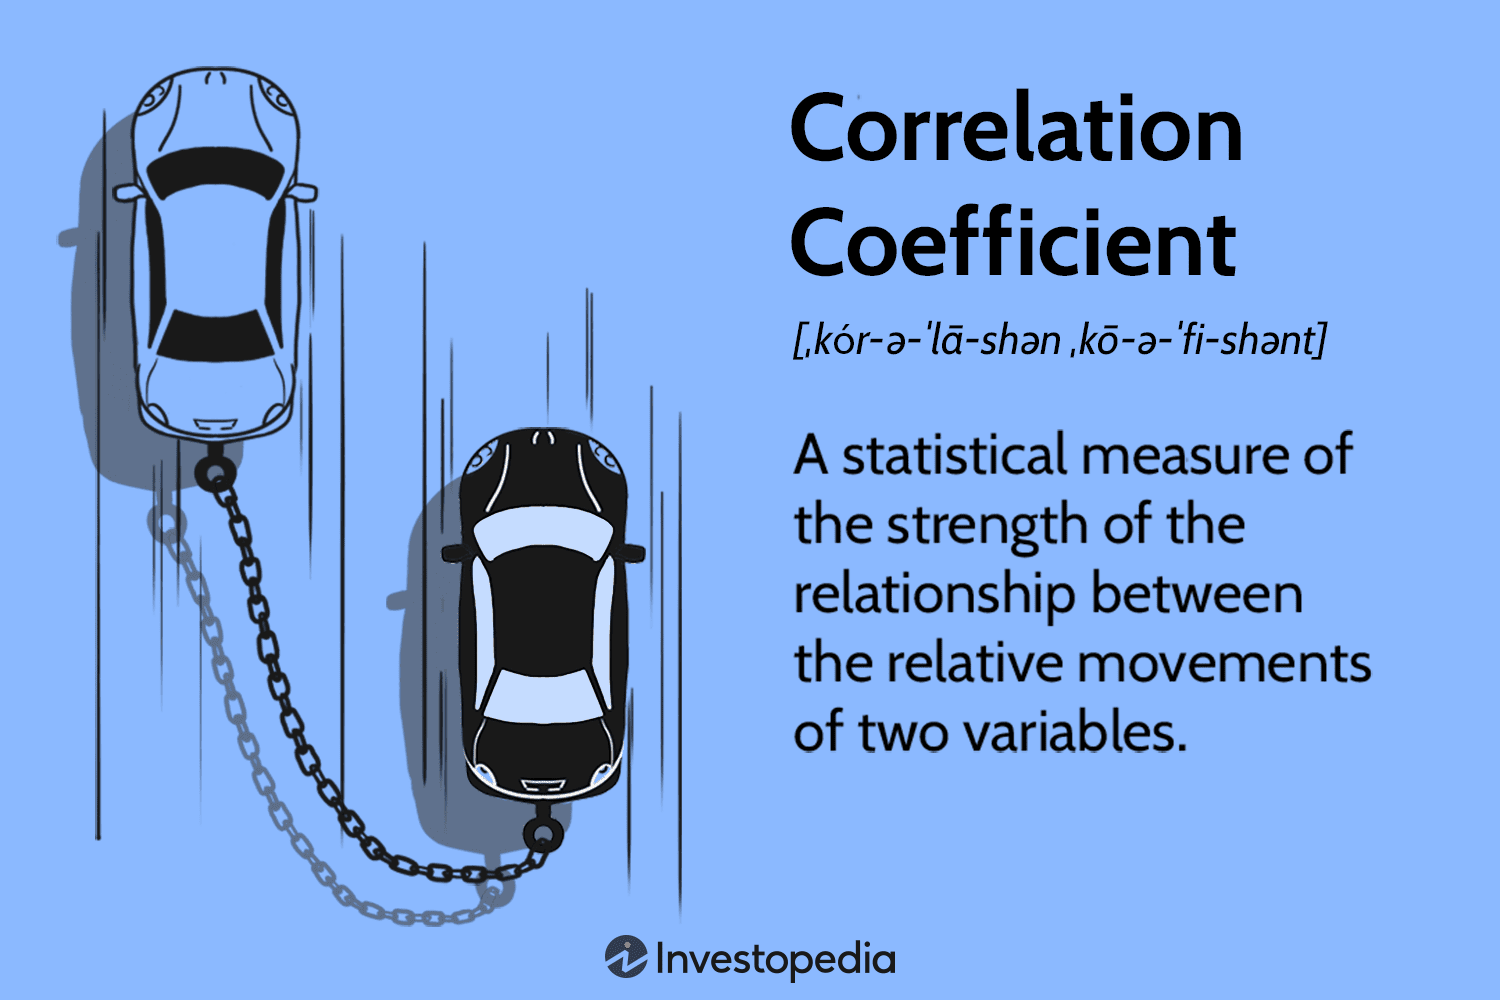
Correlation in SPSSCorrelation in SPSS
Correlation is a statistical technique used to measure the strength of the relationship between two variables. It is used to determine how closely two variables are related to each other.

Descriptive Statistics in SPSSDescriptive Statistics in SPSS
Descriptive statistics is a branch of statistics that deals with the collection, organization, analysis, and interpretation of data. It is used to describe the characteristics of a given population or
Frequency Analysis with SPSSFrequency Analysis with SPSS
Frequency in SPSS is a powerful tool for analyzing data. It allows you to quickly and easily summarize data, identify patterns, and draw conclusions. Frequency can be used to calculate
Paired Sample T-Test: Get Accurate Results from Your Data AnalysisPaired Sample T-Test: Get Accurate Results from Your Data Analysis
The Paired Sample t-test is a statistical test used to compare the means of two related samples. It is used to determine if there is a significant difference between the
Statistical Significance with the T-TestStatistical Significance with the T-Test
The t-test is a statistical test used to compare the means of two independent samples. It is used to determine whether there is a statistically significant difference between the means

Quasi-Experimental StudiesQuasi-Experimental Studies
Quasi-experimental studies are a type of research design that is used to study the effects of a particular intervention or treatment on a group of individuals. Unlike true experimental studies,