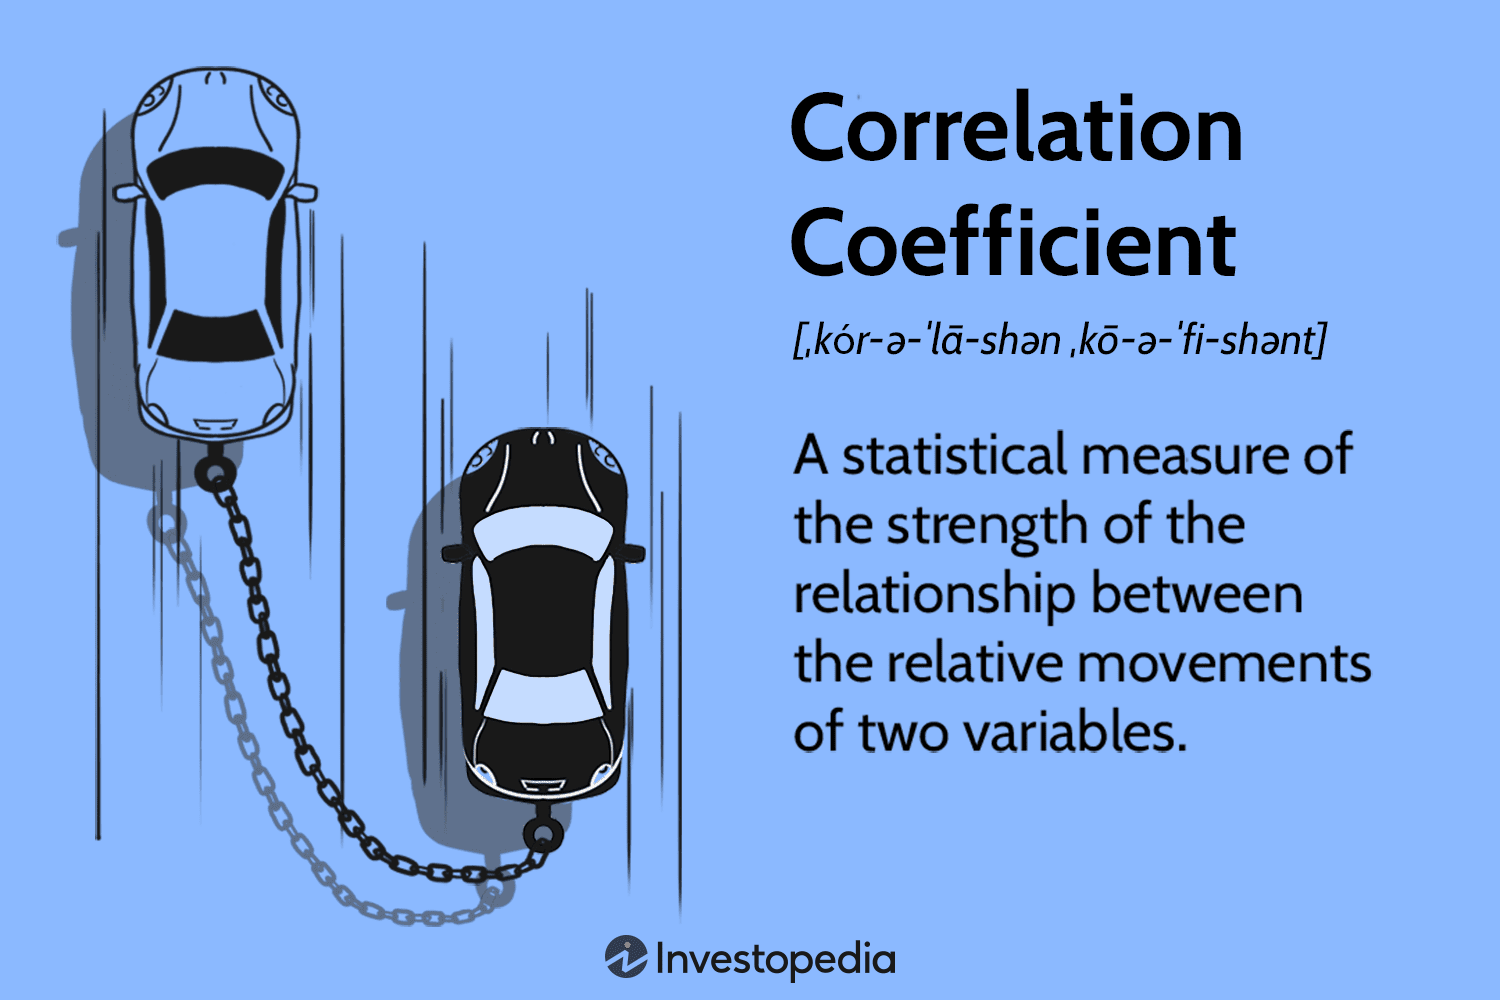
Correlation is a statistical technique used to measure the strength of the relationship between two variables. It is used to determine how closely two variables are related to each other. Correlation can be used to measure the strength of the relationship between two variables, or to determine if there is a relationship between two variables. In SPSS, correlation is used to measure the strength of the relationship between two variables, or to determine if there is a relationship between two variables. Correlation can be used to identify relationships between variables, to identify trends in data, and to make predictions about future data. Correlation can also be used to compare the strength of relationships between different variables. Correlation can be used to identify relationships between variables, to identify trends in data, and to make predictions about future data.
Exploring Correlation Analysis in SPSS: A Step-by-Step Guide
Correlation analysis is a powerful statistical technique used to measure the strength of the relationship between two or more variables. It is a widely used tool in the social sciences, and is especially useful for exploring relationships between variables that are difficult to measure directly. This article provides a step-by-step guide to conducting a correlation analysis in SPSS, a popular statistical software package.
Step 1: Prepare the Data
Before beginning the analysis, it is important to ensure that the data is properly prepared. This includes checking for missing values, outliers, and other potential issues. It is also important to ensure that the variables are measured on the same scale. For example, if one variable is measured on a scale of 1-10 and another is measured on a scale of 1-100, the results of the analysis may be misleading.
Step 2: Select the Correlation Analysis
Once the data is prepared, the next step is to select the appropriate correlation analysis. In SPSS, this can be done by selecting “Analyze” from the menu bar, then “Correlate”, and then “Bivariate”. This will open a dialog box where the user can select the type of correlation analysis to be conducted.
Step 3: Select the Variables
The next step is to select the variables to be included in the analysis. This can be done by clicking the “Variables” button in the dialog box. This will open a list of all the variables in the dataset. The user can then select the variables to be included in the analysis by clicking on them.
Step 4: Specify the Options
Once the variables have been selected, the user can specify the options for the analysis. This includes selecting the type of correlation coefficient to be used (e.g. Pearson, Spearman, etc.), as well as any additional options such as confidence intervals or significance tests.
Step 5: Run the Analysis
Once all the options have been specified, the user can click the “OK” button to run the analysis. This will generate a table of results, which can be interpreted to determine the strength of the relationship between the variables.
By following these steps, researchers can easily conduct a correlation analysis in SPSS. This powerful technique can be used to explore relationships between variables that are difficult to measure directly, and can provide valuable insights into the data.
How to Interpret Correlation Results in SPSS
Interpreting correlation results in SPSS requires an understanding of the correlation coefficient and its associated significance value. The correlation coefficient is a measure of the strength of the linear relationship between two variables. It ranges from -1 to +1, with -1 indicating a perfect negative linear relationship, +1 indicating a perfect positive linear relationship, and 0 indicating no linear relationship. The significance value indicates the probability that the observed correlation is due to chance. A significance value of less than 0.05 indicates that the correlation is statistically significant and is unlikely to be due to chance.
When interpreting correlation results in SPSS, it is important to consider the magnitude of the correlation coefficient as well as the significance value. A correlation coefficient of 0.5 or higher indicates a strong linear relationship between the two variables, while a correlation coefficient of 0.3 or lower indicates a weak linear relationship. The significance value should also be taken into account when interpreting the results. If the significance value is less than 0.05, then the correlation is statistically significant and is unlikely to be due to chance.
In summary, interpreting correlation results in SPSS requires an understanding of the correlation coefficient and its associated significance value. The magnitude of the correlation coefficient should be taken into account when interpreting the results, with a coefficient of 0.5 or higher indicating a strong linear relationship and a coefficient of 0.3 or lower indicating a weak linear relationship. The significance value should also be taken into account, with a value of less than 0.05 indicating that the correlation is statistically significant and is unlikely to be due to chance.
Using SPSS to Calculate Pearson’s Correlation Coefficient
Pearson’s correlation coefficient is a measure of the strength of the linear relationship between two variables. It is a widely used statistical measure that can be used to assess the strength of the relationship between two variables. The Pearson’s correlation coefficient can be calculated using SPSS, a statistical software package.
To calculate the Pearson’s correlation coefficient in SPSS, the user must first enter the data into the software. Once the data is entered, the user must select the “Analyze” tab and then select “Correlate” from the drop-down menu. The user must then select the two variables that they wish to analyze and click “OK”. SPSS will then generate a correlation matrix that includes the Pearson’s correlation coefficient for the two variables.
The Pearson’s correlation coefficient is a number between -1 and 1. A coefficient of -1 indicates a perfect negative linear relationship between the two variables, while a coefficient of 1 indicates a perfect positive linear relationship. A coefficient of 0 indicates that there is no linear relationship between the two variables.
The Pearson’s correlation coefficient can be used to assess the strength of the linear relationship between two variables. It is a useful tool for researchers and can be easily calculated using SPSS.
Understanding the Difference Between Correlation and Causation in SPSS
Correlation and causation are two important concepts in the field of statistics. Correlation is a measure of the strength of the relationship between two variables, while causation is the relationship between two variables in which one variable causes the other. Understanding the difference between these two concepts is essential for correctly interpreting the results of statistical analyses.
In SPSS, correlation is measured using the Pearson correlation coefficient, which is a measure of the linear relationship between two variables. The coefficient ranges from -1 to +1, with -1 indicating a perfect negative correlation, 0 indicating no correlation, and +1 indicating a perfect positive correlation. The coefficient can be used to determine the strength of the relationship between two variables, but it cannot be used to determine causation.
Causation, on the other hand, is a relationship between two variables in which one variable causes the other. In SPSS, causation is typically determined using regression analysis. Regression analysis is a statistical technique that is used to determine the relationship between two or more variables. It can be used to determine the effect of one variable on another, and it can also be used to determine the strength of the relationship between two variables.
In conclusion, it is important to understand the difference between correlation and causation in SPSS. Correlation is a measure of the strength of the relationship between two variables, while causation is the relationship between two variables in which one variable causes the other. Regression analysis is the most commonly used technique for determining causation in SPSS. Understanding the difference between correlation and causation is essential for correctly interpreting the results of statistical analyses.
Analyzing Multiple Correlations in SPSS: A Comprehensive Guide
Correlation analysis is a powerful tool for understanding the relationships between two or more variables. It is a common statistical technique used in the social sciences, and it can be used to identify relationships between variables, test hypotheses, and make predictions. In SPSS, correlation analysis can be used to analyze multiple correlations between two or more variables. This guide provides a comprehensive overview of how to analyze multiple correlations in SPSS.
The first step in analyzing multiple correlations in SPSS is to enter the data into the software. This can be done by entering the data into a spreadsheet or by importing the data from an external source. Once the data is entered, the next step is to select the appropriate correlation analysis. In SPSS, there are several different types of correlation analyses available, including Pearson’s correlation, Spearman’s correlation, and Kendall’s tau. Depending on the type of data being analyzed, one of these methods may be more appropriate than the others.
Once the appropriate correlation analysis has been selected, the next step is to specify the variables to be included in the analysis. This can be done by selecting the variables from the list of available variables in the data set. It is important to note that the variables should be selected carefully, as the results of the analysis will depend on the variables chosen.
Once the variables have been selected, the next step is to run the analysis. This can be done by clicking the “Analyze” button in the toolbar and then selecting “Correlate” from the list of available analyses. In the “Correlate” dialog box, the variables to be included in the analysis should be selected, and the type of correlation analysis should be specified. Once the analysis is run, the results will be displayed in the output window.
The output window will display the correlation coefficients for each pair of variables, as well as the significance level of the correlation. The correlation coefficients indicate the strength of the relationship between the two variables, with a coefficient of 1 indicating a perfect correlation and a coefficient of 0 indicating no correlation. The significance level indicates the probability that the correlation is due to chance. If the significance level is less than 0.05, then the correlation is considered to be statistically significant.
Finally, it is important to interpret the results of the analysis. The results should be interpreted in the context of the research question being asked. For example, if the research question is whether or not there is a relationship between two variables, then the results of the analysis should be interpreted in terms of whether or not the correlation is statistically significant. If the correlation is statistically significant, then it can be concluded that there is a relationship between the two variables.
In conclusion, analyzing multiple correlations in SPSS is a powerful tool for understanding the relationships between two or more variables. By following the steps outlined in this guide, researchers can easily analyze multiple correlations in SPSS and interpret the results in the context of their research question.
Conclusion
In conclusion, correlation in SPSS is a powerful tool for exploring relationships between two or more variables. It can help researchers identify relationships between variables, determine the strength of those relationships, and identify any outliers or trends. Correlation in SPSS can also be used to identify potential causal relationships between variables. By using correlation in SPSS, researchers can gain valuable insights into their data and make more informed decisions.
Discussion
[wpaicg_chatgpt]