Frequency in SPSS is a powerful tool for analyzing data. It allows you to quickly and easily summarize data, identify patterns, and draw conclusions. Frequency can be used to calculate the number of times a particular value appears in a dataset, as well as the percentage of times it appears. It can also be used to compare the frequency of different values in a dataset. Frequency in SPSS is a great way to quickly and easily analyze data and draw meaningful conclusions.
How to Calculate Frequency Distributions in SPSS
Frequency distributions are a useful tool for summarizing and analyzing data in SPSS. This guide will provide step-by-step instructions on how to calculate frequency distributions in SPSS.
1. Open the SPSS software and select the “File” tab.
2. Select “Open” and choose the data file you wish to analyze.
3. Select the “Analyze” tab and then select “Descriptive Statistics” and “Frequencies.”
4. Select the variable you wish to analyze and click “OK.”
5. Select the “Statistics” tab and check the box next to “Frequency.”
6. Select the “Charts” tab and select the type of chart you wish to generate.
7. Select the “Format” tab and select the type of formatting you wish to apply to the chart.
8. Select the “Output” tab and click “OK.”
9. The frequency distribution will be generated in the output window.
By following these steps, you can easily calculate frequency distributions in SPSS. Frequency distributions are a useful tool for summarizing and analyzing data, and can be used to identify patterns and trends in the data.
Using SPSS to Analyze Frequency Data
Frequency data is a type of data that is used to measure the number of times a particular event or outcome occurs. It is often used to measure the frequency of certain behaviors or responses in a population. SPSS is a statistical software package that can be used to analyze frequency data.
The first step in analyzing frequency data using SPSS is to enter the data into the software. This can be done by entering the data into a spreadsheet or by importing the data from an external source. Once the data is entered, it can be analyzed using a variety of statistical techniques.
One of the most common techniques used to analyze frequency data is the chi-square test. This test is used to determine if there is a significant difference between two or more groups of data. To perform a chi-square test, the data must be organized into a contingency table. This table is then used to calculate the chi-square statistic. If the chi-square statistic is significant, then there is a significant difference between the groups.
Another technique used to analyze frequency data is the Fisher’s exact test. This test is used to determine if there is a significant difference between two or more proportions. To perform a Fisher’s exact test, the data must be organized into a contingency table. This table is then used to calculate the Fisher’s exact statistic. If the Fisher’s exact statistic is significant, then there is a significant difference between the proportions.
Finally, SPSS can also be used to analyze frequency data using descriptive statistics. Descriptive statistics are used to summarize the data and provide information about the distribution of the data. Common descriptive statistics include the mean, median, mode, and standard deviation.
In conclusion, SPSS is a powerful statistical software package that can be used to analyze frequency data. It can be used to perform chi-square tests, Fisher’s exact tests, and descriptive statistics. By using SPSS, researchers can gain valuable insights into the frequency of certain behaviors or responses in a population.
Exploring the Benefits of Frequency Tables in SPSS
Frequency tables are a useful tool for summarizing and analyzing data in SPSS. They provide a quick and easy way to visualize the distribution of a variable, allowing researchers to quickly identify patterns and trends in the data. Frequency tables can also be used to compare different groups of data, such as different age groups or genders.
Frequency tables are especially useful for categorical variables, such as gender or marital status. They provide a simple way to summarize the data and can be used to calculate percentages and other summary statistics. For example, a frequency table can be used to calculate the percentage of respondents who are married, single, or divorced.
Frequency tables can also be used to compare different groups of data. For example, a researcher may want to compare the responses of men and women to a survey question. By creating a frequency table, the researcher can quickly compare the responses of the two groups and identify any differences.
Frequency tables can also be used to identify outliers in the data. By looking at the frequency table, the researcher can quickly identify any values that are significantly different from the rest of the data. This can be useful for identifying potential errors in the data or for identifying potential areas of further research.
Overall, frequency tables are a useful tool for summarizing and analyzing data in SPSS. They provide a quick and easy way to visualize the distribution of a variable, allowing researchers to quickly identify patterns and trends in the data. Frequency tables can also be used to compare different groups of data, identify outliers, and calculate summary statistics. As such, frequency tables are an invaluable tool for researchers working with SPSS.
Tips for Interpreting Frequency Data in SPSS
1. Ensure that the data is properly coded and entered into SPSS. This includes checking for any errors or inconsistencies in the data.
2. Use descriptive statistics to summarize the data. This includes calculating the mean, median, mode, and range of the data.
3. Use graphical displays to visualize the data. This includes creating histograms, bar charts, and line graphs.
4. Use inferential statistics to test for any significant differences between groups. This includes performing t-tests, ANOVAs, and chi-square tests.
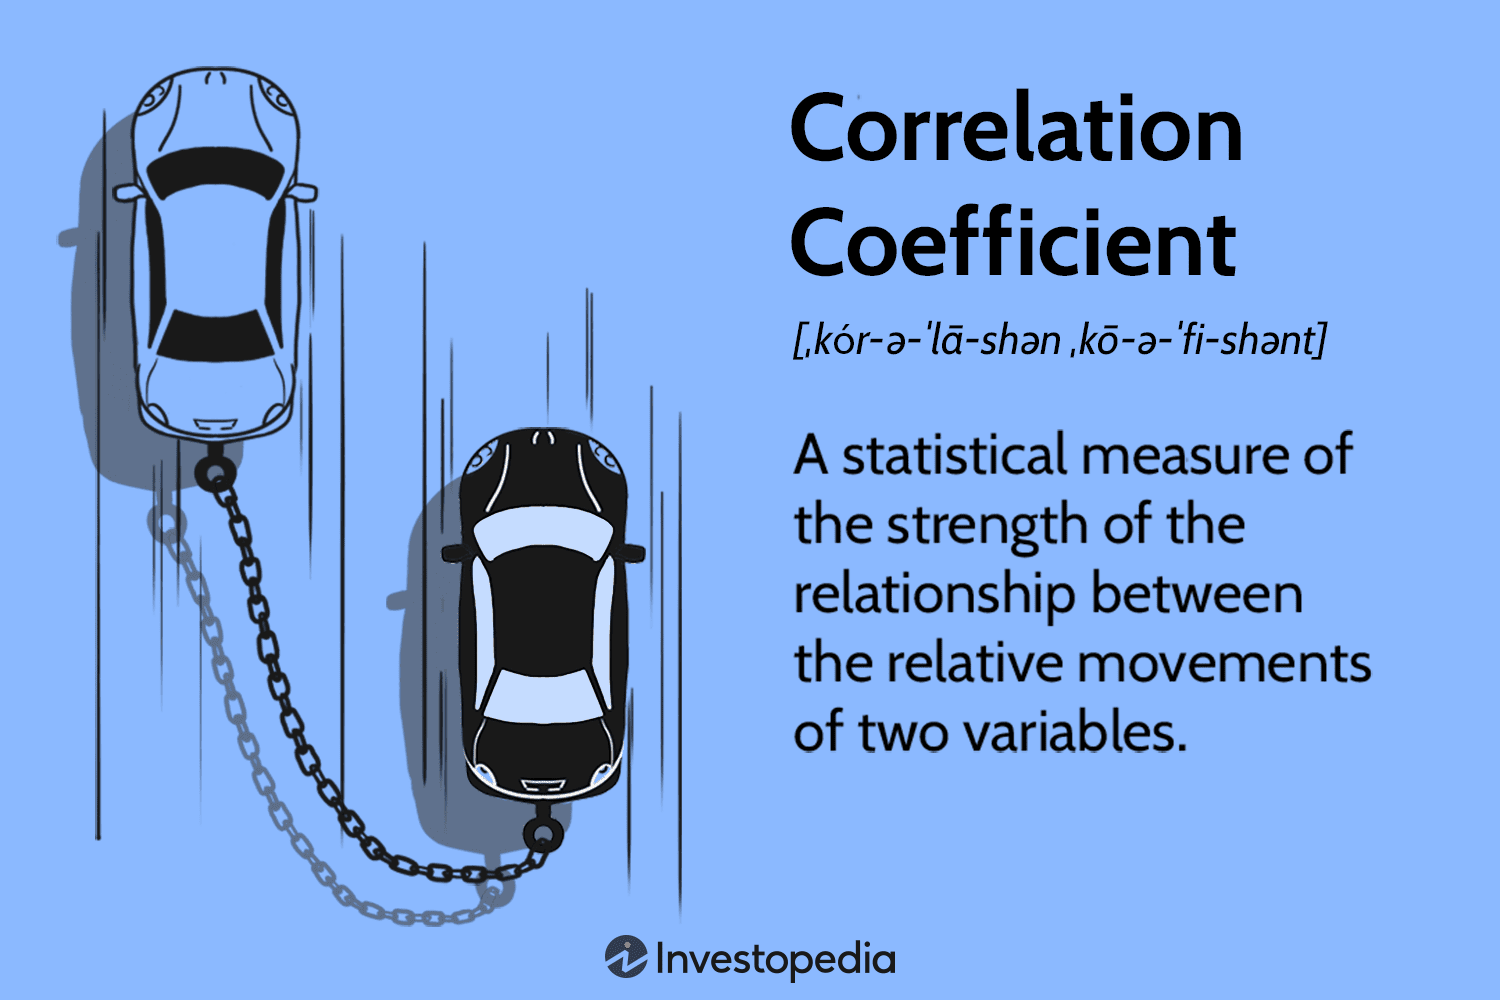
5. Interpret the results of the statistical tests. This includes determining the strength of the relationships between variables and making conclusions about the data.
6. Report the results of the analysis. This includes providing a summary of the findings and discussing the implications of the results.
Understanding the Different Types of Frequency Distributions in SPSS
Frequency distributions are a key tool used in statistical analysis to summarize and present data. In SPSS, there are several types of frequency distributions that can be used to analyze data. This article will provide an overview of the different types of frequency distributions available in SPSS and how they can be used to analyze data.
The first type of frequency distribution available in SPSS is the simple frequency distribution. This type of distribution is used to summarize the frequency of occurrence of each value in a dataset. It is a basic form of data analysis that can be used to identify patterns and trends in the data.
The second type of frequency distribution available in SPSS is the cumulative frequency distribution. This type of distribution is used to summarize the cumulative frequency of occurrence of each value in a dataset. It is useful for identifying the overall pattern of the data and for comparing different datasets.
The third type of frequency distribution available in SPSS is the relative frequency distribution. This type of distribution is used to summarize the relative frequency of occurrence of each value in a dataset. It is useful for comparing the relative frequency of different values in a dataset.
The fourth type of frequency distribution available in SPSS is the grouped frequency distribution. This type of distribution is used to summarize the frequency of occurrence of each value in a dataset by grouping the values into categories. It is useful for identifying patterns and trends in the data and for comparing different datasets.
Finally, the fifth type of frequency distribution available in SPSS is the percentile frequency distribution. This type of distribution is used to summarize the percentile of occurrence of each value in a dataset. It is useful for identifying the overall pattern of the data and for comparing different datasets.
In conclusion, SPSS provides several types of frequency distributions that can be used to analyze data. Each type of distribution has its own advantages and disadvantages, and it is important to understand the different types of distributions available in SPSS in order to effectively analyze data.
Conclusion
In conclusion, SPSS is a powerful tool for analyzing frequency data. It allows users to quickly and easily generate descriptive statistics, such as frequencies, percentages, and cross-tabulations. It also provides a variety of options for customizing the output, such as sorting, filtering, and formatting. With its intuitive interface and powerful features, SPSS is an invaluable tool for analyzing frequency data.
Discussion
[wpaicg_chatgpt]