
AI for Quantitative Research

AI for Quantitative Research
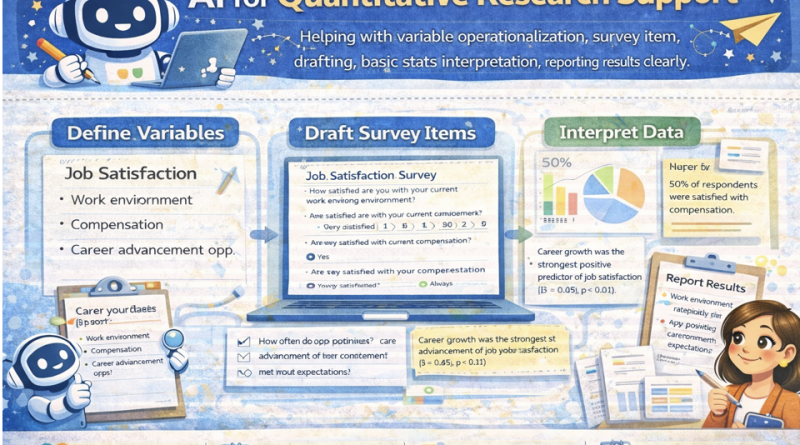
Use AI to support variable operationalization, survey item drafting, basic statistics interpretation, and clear reporting—while keeping researcher control, transparency, and validity. Includes a hands-on quant lab and an end-of-lesson problem-solving task.
Mic: Off
Tip: For best voice options, use Chrome/Edge. If voices don’t appear yet, click once on the page and wait 2–3 seconds.
1) Outcomes
By the end, you can…
- Operationalize constructs into measurable variables (DV/IV/covariates).
- Draft survey items with clear wording, scale anchors, and reverse items.
- Interpret basic statistics (mean, SD, correlations, t-tests) carefully.
- Report results clearly using APA-style quantitative reporting patterns (numbers, effect, interpretation).
- Maintain researcher control: validity checks, assumptions, and transparency.
Researcher control rules
- AI drafts; you validate (construct validity, content validity, reliability).
- Never “infer causality” from correlational data.
- Check assumptions (normality, independence) before interpreting tests.
- Keep an audit trail: prompts, decisions, revisions, and versioning.
Principle: AI can help with structure and clarity, but you must ensure measurement quality and correct interpretation.
2) Conversation (Quant Research Coach)
Practice a disciplined workflow: research question → variables → operationalization → items → analysis plan → reporting.
Tip: A strong quantitative prompt includes: population, constructs, proposed measures, and planned analysis.
3) Reading + Comprehension Quiz
Reading: Using AI responsibly in quantitative research
1 AI can support quantitative research by drafting variable definitions, survey items, and reporting language.
However, the quality of quantitative research depends on measurement validity, reliability, and correct statistical reasoning.
AI output should be treated as a starting point that requires researcher checking.
2 Operationalization turns an abstract construct (e.g., motivation) into measurable indicators. A good operational definition specifies:
the construct, the population, the scale or instrument, scoring, and expected direction. It also clarifies what the measure does not capture.
3 AI can help draft survey items, but item quality requires attention to wording (one idea per item), avoiding leading language,
appropriate response scales, and cultural/context suitability. Pilot testing and reliability checks (e.g., internal consistency) remain essential.
4 For statistics, AI can assist with interpretation, but common errors include confusing correlation with causation, ignoring assumptions,
and overinterpreting small differences. Good reporting communicates the test used, key numbers, effect size where possible, and practical meaning.
5 Researcher control means transparency: document how AI assisted, what you checked, and what decisions you made.
This protects the study’s integrity and helps readers evaluate evidence.
Comprehension check (choose the best answer)
4) Quantitative Toolkit (Operationalization, items, stats, reporting)
Operationalization template
Survey item quality checklist
Basic stats interpretation guardrails
Reporting template (clear, APA-friendly)
Validity & reliability checklist (printable)
5) Prompts + Examples (Copy & Adapt)
These prompts force clarity: operational definitions, item boundaries, analysis plan, assumptions, and reporting.
Prompt 1 — Operationalize variables (DV/IV/covariates)
Prompt 2 — Draft survey items + scales
Prompt 3 — Analysis plan + assumptions
Prompt 4 — Reporting results clearly
Mini example (expected output style)
6) Listening (Two Google Voices) — “Measurement first, stats second”
Listen to two instructors discussing how AI supports quantitative work without breaking validity.
7) Quant Research Lab (Enter variables + numbers → generate interpretation & report)
Provide your DV/IV and either (A) descriptive stats or (B) a test summary (t, p, means/SDs) or (C) correlation (r, p).
The lab will produce an operationalization draft, item suggestions, and a clear results paragraph.
Reminder: This is formatting + reasoning support; you must verify assumptions and calculations.
Reminder: This is formatting + reasoning support; you must verify assumptions and calculations.
A) Study setup
Tip: Be explicit about direction (e.g., higher scores = more motivation).
B) Numbers to interpret (paste)
Tip: If you have effect size, include it (d, η², R²). If not, the lab will suggest what to compute.
Lab output: Operationalization + Items + Reporting
Safe AI prompt (for quantitative support without errors)
8) Problem-solving
Scenario: You measure “speaking confidence” and “chatbot usage frequency.”
A colleague claims: “Chatbot usage causes higher confidence” because the correlation is significant.
Your task:
Your task:
- Write a correction (3–5 lines) explaining why correlation ≠ causation.
- Propose 2 alternative explanations (confounds).
- Suggest one improved design that supports causal inference.
- Rewrite the claim into a statistically accurate statement for a paper.
A) Correction (3–5 lines)
B) Alternative explanations (2 bullets)
C) Improved design (1 proposal)
D) Accurate rewrite
Progress
0
Activities completed
0%
Average score
0
Checklist items used
Saved locally in your browser (local storage).